
In the ever-evolving marketing landscape, staying ahead of the curve is…
Key Takeaways
- The sheer number of applications in a marketing stack creates data silos within an organization.
- Connecting data sets and cross-channel performance into campaign dashboards can be adjusted in real time to increase revenue and reduce costs.
- Several strategies can be employed to overcome barriers to a 360-degree view of your marketing performance indicators.
The symbiotic relationship between statistics and sports has existed since the first professional contests were played well over a century ago.
If anything, this interdependent relationship has grown in recent years through fantasy sports and partnerships between technology firms and sports leagues, like that between Amazon and the NFL. You can even see this relationship in the best-selling book “Moneyball” by Michael Lewis and the accompanying film starring Brad Pitt, highlighting how the cash-strapped Oakland Athletics leveled the playing field in Major League Baseball by using data analytics.
The realization that data can help make better decisions in sports and in business has never been higher. However, due to numerous factors, including the sheer amount of data, data silos within organizations, poorly designed business processes, talent shortages and even the lack of real-time dashboards, few firms have been able to fully leverage the value of data in their organizations. This means opinion-driven decisions — and not data-driven decisions — still account for many if not most decisions within an organization.
Your marketing department is a perfect illustration of why this is the case. The Salesforce Digital Advertising 2020 Report found that advertisers planned to increase the number of data sources used in campaigns from 5.4 in 2018 to 6.2 in 2019, with the most common data types being CRM data, online data and demographic data.
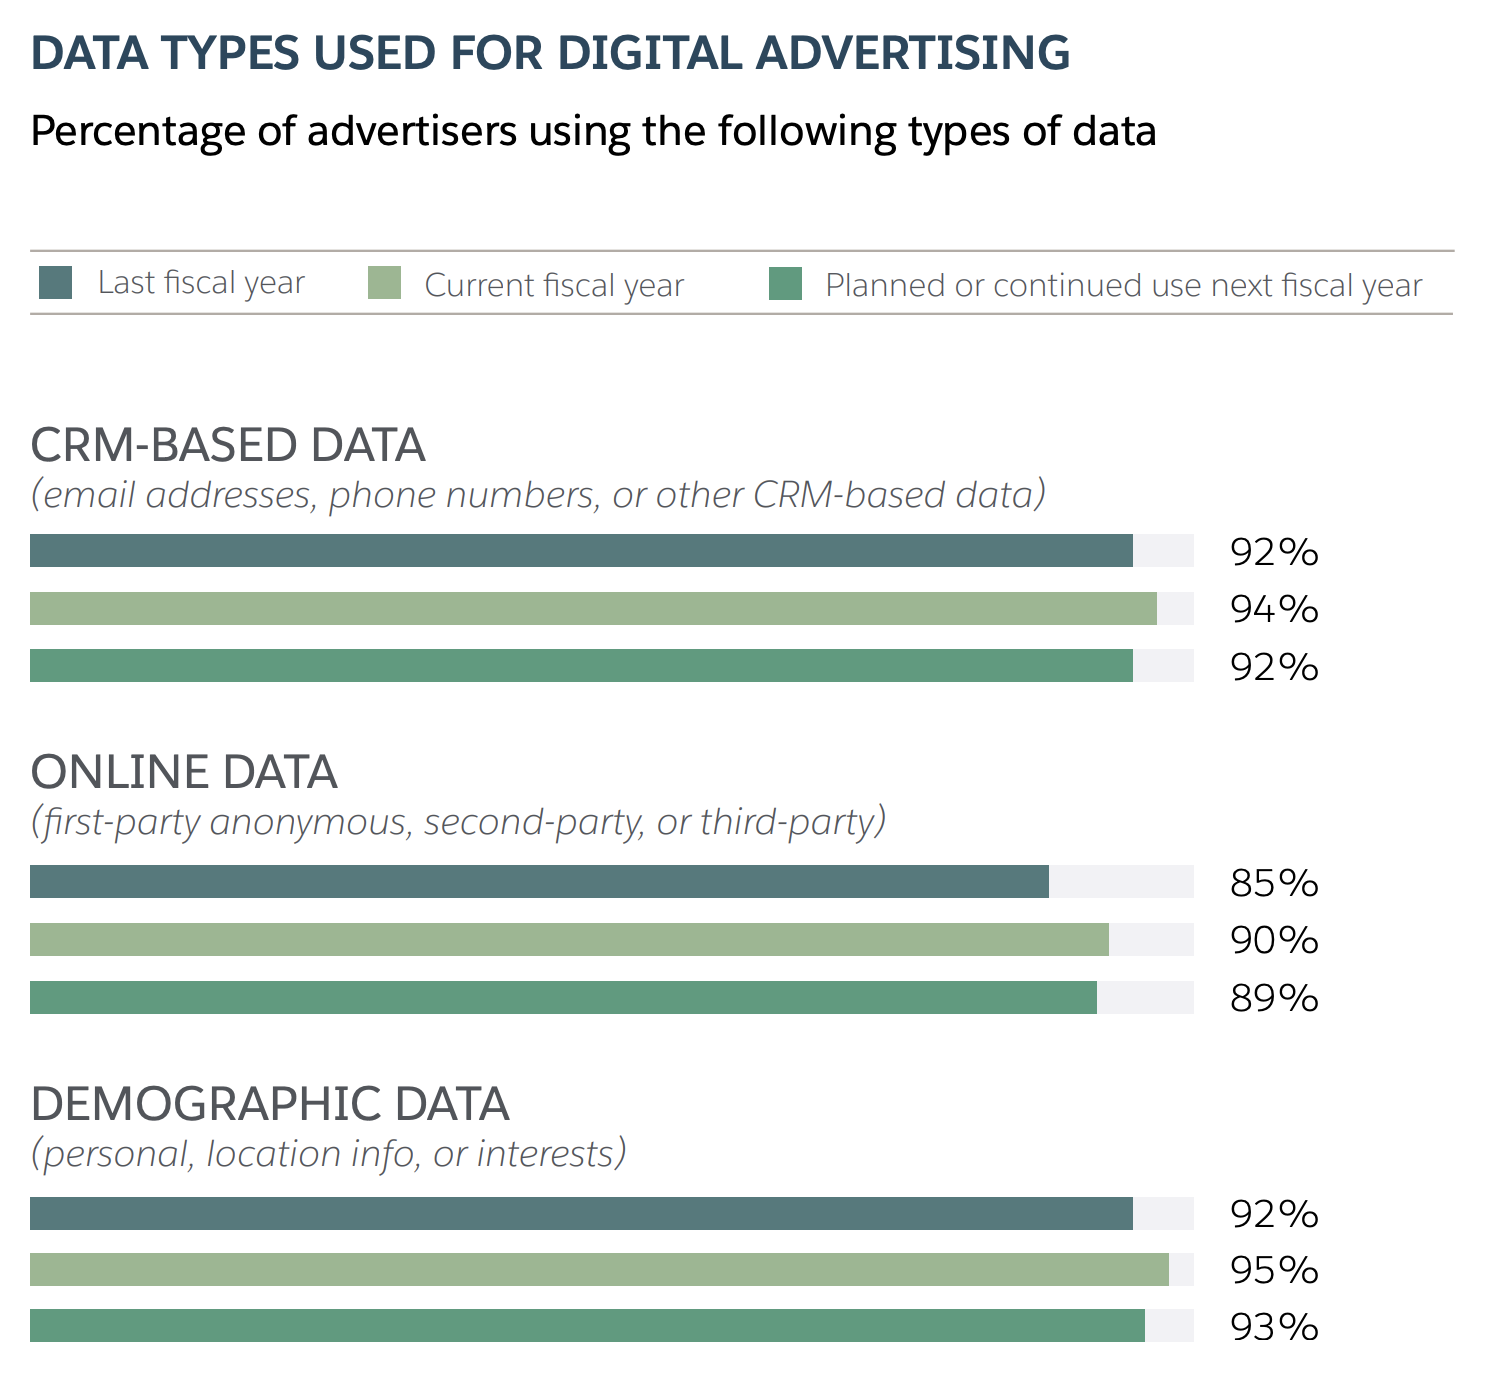
Source: Salesforce Digital Advertising 2020 Report
The problem is these three data types are actually a roll-up of many data sources including CRM, marketing automation, web analytics, event, webinar, paid search platforms, paid social platforms and internal company databases. Gone are the days where a customer only interacts with your brand in one channel, and very few marketing channels are not going to encompass multiple data sets.
Here is an example of how data flows across multiple touch points in just one campaign. Ted is a digital marketing manager for a regional grocery store chain. With Mother’s Day approaching he plans to run several Google Ads campaigns in targeted markets to highlight his company’s floral offerings. Users who click through the ad go to landing pages on his website highlighting different packages. Known users who begin the purchase process but abandon their carts are sent an email with a coupon good between now and Mother’s Day. Unknown users who get to the site but don’t convert are retargeted with display ads and on paid social channels.
The components of this campaign from end-to-end include:
- Google Adwords (cost, impressions and clicks).
- Google Analytics (web platform for pages, form completes, bounces and potential purchases, if e-commerce tracking is in use).
- E-commerce platform (e.g., Magento, which will include revenue, quantity purchased, SKUs, average order value, returns, lifetime value of the customer, abandoned carts, etc.).
- A marketing automation system or the use of an e-commerce system to send an abandoned cart email with a coupon (tracks opens, clicks and revenue from the coupon via UTM tagging).
- Google display network (impressions/clicks/cost).
- Paid social platform (we’ll say Facebook) impressions and clicks.
The good news is each of these platforms contains great insight for that specific platform. However, they don’t track the customer journey to upstream or downstream platforms to determine the overall effectiveness of the campaign. Additionally, each has its own attribution models, meaning campaign-level data will show discrepancies. So what is a marketer to do?
In our example, imagine how helpful it would be if Ted could have one unified dashboard to track the effectiveness of his campaign. This would allow him to gain customer journey data visualization to see where conversion problems exist and make changes to content, designs or user flows to optimize the return on ad spend as well as the overall ROI of the campaign.
Now extrapolate out similar dashboards for all of the campaigns and channels that Ted is responsible for on a weekly, monthly or annual basis. Go one step further to consider what would happen if the entire marketing team had access to relevant dashboards for its work. How much wasted digital spend would be saved? How much additional revenue would be realized?
These real-time scoreboards would let the team know if they are winning or losing ground to inform strategy within the moment. This lets front-line employees know when to put on a full-court press, when to pull back or when to adjust strategy.
The value of this insight is too important for industry leading firms to ignore, which is why data analytics continues to be one of the most sought-after skills sets needed within organizations. A KPMG survey of CIOs found that the top skill shortage facing organizations was their ability to collect, analyze and visualize data for decision-making. Furthermore, a recent LinkedIn study found that there are over 150,000 unfilled data science positions.
Few would dispute the value of data in the decision-making process, but with the scarcity of talent and complexity of systems what steps can be taken today to better utilize data?
The first step for any organization is to set up a strong data foundation to connect systems together, map data elements between systems and standardize data. Our data architecture team and partner network use a few different approaches to accomplish this. The best two options are:
- To create a cloud-based data lake or data mart using data transformation tools to move data from different locations into the database.
- Leveraging a customer data platform (CDP) tag and stitch data together from different systems.
From there a dashboard tool is built on top of this customer data repository to provide the insights needed for your organization. Another way to accomplish a similar view into your customer data is to use a BI analytics tool to pull data from various sources directly. Most cloud BI platforms have pre-built connectors with key data sources like leading CRM systems, marketing automation tools, web analytics tools, reporting tools and more. They also include the ability to standardize and clean data within the tool.
If your data source doesn’t have a pre-built connector into your BI tool then you will need a development resource to make and manage these connections with an API. As a best practice, the most robust BI visualization solution is using a data lake or CDP to ensure standardization and master record management across all systems.
The second step involves a change in mindset for most organizations. Companies must be willing to embrace the democratization of data, meaning that data is freely shared between different platforms and business units. This doesn’t mean that the data is less secure, as role-based security should be used to determine who gets access to what information. While this creates more complexity, it also creates more value with the right people having access to data that impacts their role.
The other key shift is from a centralized reporting model to a more decentralized self-service strategy. While there should be a centralized team that connects, manages and validates data from different systems so there is one “true” source of data, that team should not focus its efforts on creating reports for end users. By adopting a self-service BI reporting model, users take responsibility for proactively managing and manipulating data relevant to them. Some of the upsides of this self-service approach include:
- Non-technical users are able to analyze their own data to make decisions that impact results.
- The wide availability of pertinent data takes the guesswork out of decision-making to drive actions that are data-driven and not opinion driven.
- It reduces operational demand on the technology team to build reports for users.
- Real-time data analysis helps future-proof your team so it can respond to changing conditions more quickly to stay ahead of the curve.
By embracing these tips your organization can level the playing field in your industry just as the Oakland A’s did in “Moneyball.” Zirous, a technology data and insights company established by leading communications, IT and sales experts, is here to help you every step of the way.
We speak the language of business and technology to create customer-centric organizations. Contact us today to learn more.
Related Posts


This Post Has 0 Comments