
What is Cortex AI? Cortex AI is Snowflake’s native AI solution…
With the continued growth of machine learning and artificial intelligence, there is a constant need for reports, dashboards, and other ways of visualizing data. Whether you are downloading CSV files or connecting to a complex database, there is a need for visually organized information. Business intelligence tools give the opportunity to create these visualizations and complete complex analysis that is easily digestible by the user. Additionally, with an expected global market revenue growth from $16.33 to $26.5 billion between 2015 and 2021, business intelligence tools will only increase in relevance.
Where To Get Started
Now that it is clear why business intelligence tools are important, let’s go over how to get started. This initial step is the biggest hiccup for most people when it comes to business intelligence tools due to the overwhelming amount of options available and the variety of features they offer. This post will focus on how to take that first step with Microsoft’s Power BI, my personal favorite BI tool and a great starting place for many individuals and businesses. It will go over why this tool stands out against the current business intelligence market leaders, detail basic costs associated with the tool, show how you can train to be an expert business intelligence analyst, and walk through an example to show how easy it is to get started.
Why Microsoft Power BI
The business intelligence market has become saturated with product offerings. A new tool seems to pop up every time you look. To help get over the sheer clutter, here is a short list of the market leaders:
Each of these tools has unique value propositions, but in my experience, Microsoft Power BI has the lowest barrier to entry for new BI users. A number of other tools have highly technical unique and beneficial features (even some that Power BI does not). However, Power BI offers better value when it comes to cost, ease of use, and initial training, making it both one of my favorite tools and one that I highly recommend to businesses who are new to BI, have limited IT budgets, and/or don’t have highly technical reporting needs to get started.
![]()
Training
Microsoft Power BI has both free and paid training options, but the vast majority of their training aspects are free. The free training consists of videos detailing how to do specific tasks in the tool such as connecting to a database or exporting dashboards as a PDF. Microsoft includes a Guided Learning section with everything you would expect from an introductory paid course without the cost. There are also a number of other resources including webinars, blogs, documentation, and community forums. The paid training options normally consist of an organized course covering all of the major aspects of the tool. These (mainly third-party) courses vary in price and typically end with an exam showing your level of mastery with the tool.
Overall, most business intelligence user concepts transfer between tools. Learning when to use a table, matrix, or bar chart is relevant no matter what tool you initially train with. Concepts such as filters and parameters are also largely constant. This means that even if you decide to move away from Power BI in the future, the training will still be valuable in any major business intelligence tool.
Cost
Business intelligence tools sometimes get a bad rap for being incredibly expensive, and it is true that sophisticated, high-end tools like Tableau and Oracle come with high-end price tags. These tools often have price ranges starting in the hundreds or thousands of dollars. But this is not always the case. Power BI offers competitive features and quality from a price point of $10 per month per user for their online tool.
The key here is “per user.” Larger tools like Tableau and Oracle usually charge by the amount of data in the system. They usually do not charge by user, but if they do, there is typically a minimum number of users required. Power BI may not give all of the advanced options that tools like Tableau and Salesforce offer, but when you are just starting out, you likely have no need for these advanced features.
In addition to this, Power BI offers a free desktop version of their tool for users who wish to experiment with business intelligence with no budget. The Power BI desktop application can be easily downloaded and run on any modern computer here. Once downloaded, users will be able to pull in, analyze, and visualize their data with a slightly limited menu of Power BI features.
What You Can Do With Power BI: Creating Visualizations
Once you get Power BI downloaded and start to dive into the tool, you will need to connect to your dataset. Power BI is able to work with most data sources including CSV, Excel, Amazon Redshift, Azure SQL, Oracle, SAP, Snowflake, and many more.
I will be using a simple CSV file with data about the Titanic to show how easy it is to make visualizations and gain insight into data using Power BI. For our example, I will try to show if more men or women survived the crash on the Titanic.
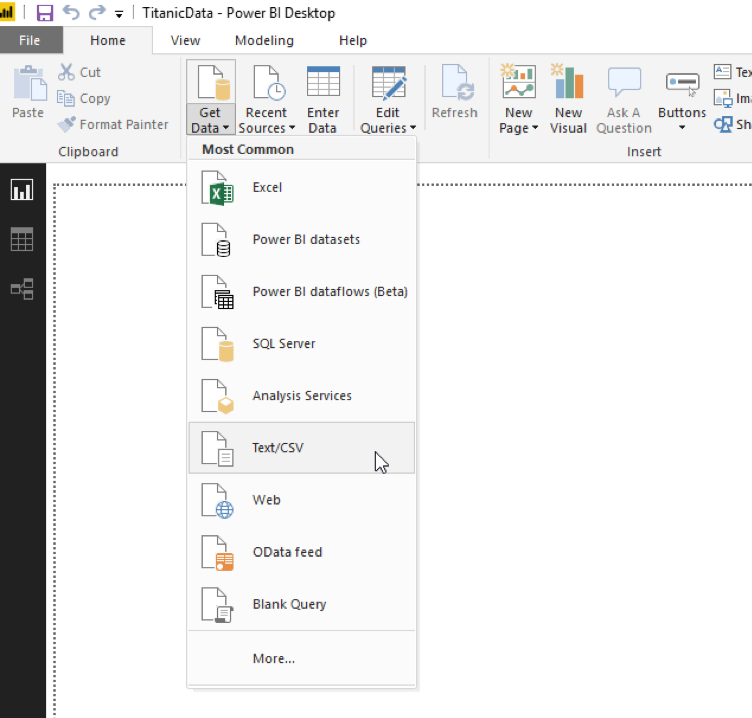
To pull in data, go to the top bar and select Get Data > Text/CSV and select the file. Select Load.
Now you can see your data on the right side of the tool under Fields. The next step is to select a visualization for our data. The icons under Visualizations to the left of Fields each represent an option. I will use a pie chart for this example. Simply double click the visualization icon you need for your own situation, and it will appear in the white canvas space.
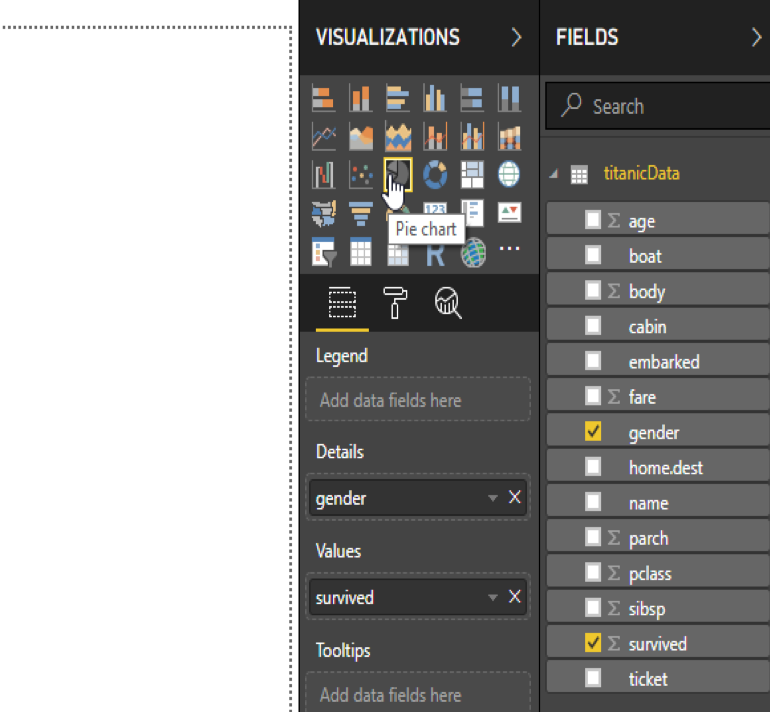
Now we need to select what data goes in the pie chart. Click the visualization and simply drag the fields into the visualization buckets. For this example, I will select “gender” for the pie chart details and “survived” for the values.
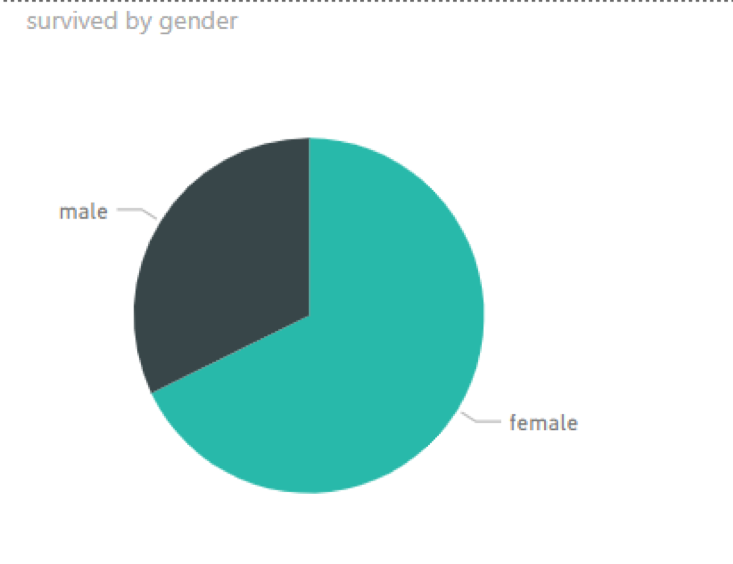
In just a few seconds we were able to analyze the data in a file and come up with additional insight. This pie chart shows that there was a significantly larger number of women who survived the sinking of the Titanic.
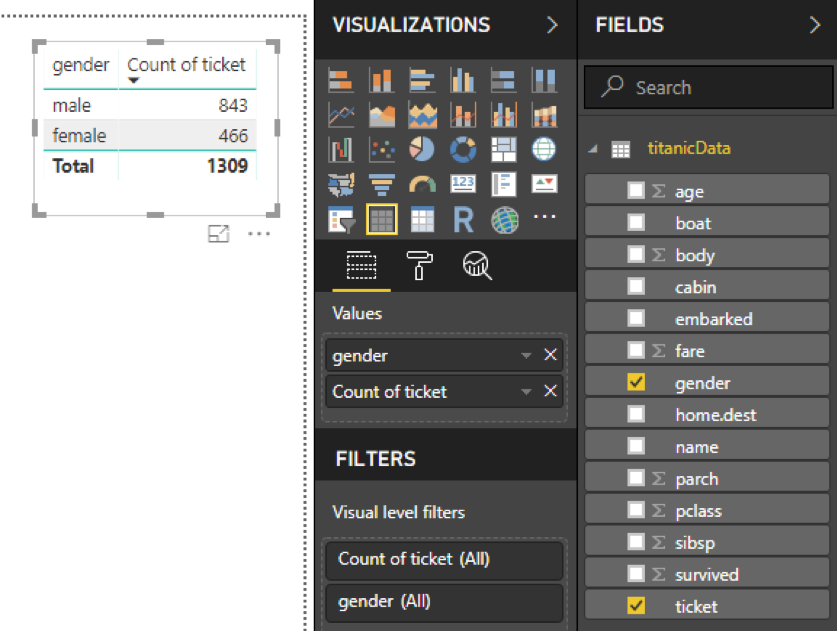
We can confirm this insight is relevant by examining the total number of males and females on the boat with a table. With 843 males and 466 females, there is almost a 2:1 ratio which further enforces our initial analysis.
This example is very simple and only uses very basic concepts, but it shows how easy it is to use the tool. After a bit of time, you will be able to do more advanced analytics including using filters, parameters, date ranges, database connections, drill-down tables, custom queries, and more.
Get Started
Business intelligence tools are not going away anytime soon. If you don’t know where to start, take that first step with Power BI. With no cost, plenty of helpful resources, and an intuitive interface, you have nothing to lose. For advanced needs, contact Zirous’ data engineering and machine learning teams for custom solutions. Big or small, you can get value and meaning out of your data with business intelligence reports and dashboards.
Related Posts


This Post Has 0 Comments